| |
Professional, Technical, and Educational |
Aspendell, California
This is an overview of some analysis done in Aspendell, California. Tract 2 of this small community is threatened by two separate avalanche paths. Jawbone Canyon is a very large path which has caused destruction in both 1969 and 1986. The smaller and quite different East Slope path has no such history of destruction, but a 100-year avalanche could sweep through part of the development and could also produce a destructive powder cloud which would continue further.
After the 1986 destruction the county had a hazard map produced, which was completed in 1989. The dashed lines in the figures below show roughly where that map delineates the avalanche hazard. New construction is now required to include proper avalanche analysis and structural engineering. One such home has been completed by Maxwell and Associates Architects. As part of that project AlpenPro did an analysis which included field surveying, statistical modeling, and physical modeling Additional studies and reports are currently in progress.
This page is intended as an overview of some of the tools, skills, methods, and possible final results of a detailed site-specific study. Actual parameters have been mostly omitted, and any mark-up lines on the web maps and figures are approximate.
Click on any image for a full size version.
Maps, Aerial Photos, and Models |
|
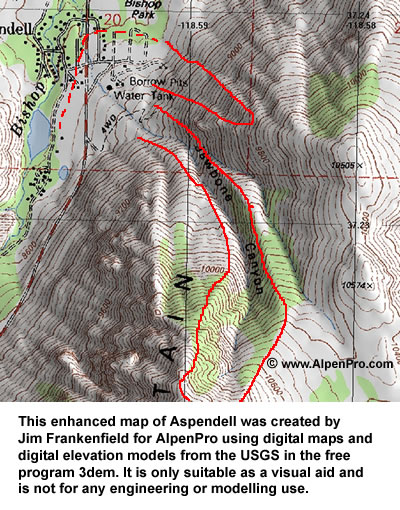 |
This is an enhanced section of a USGS 7.5' quad for the area including Aspendell. Maps can be found online as .drg files. These can be combined as an overlay with digital USGS .dem files (Digital Elevation Models). Various shadings can be applied. Click on the map for a larger version. |
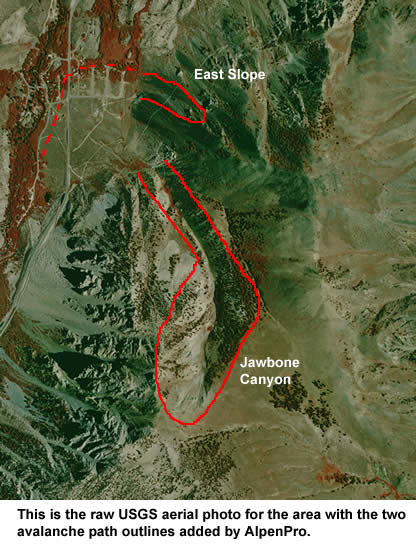 |
The USGS also makes available digital aerial photography. This is from the .doqq file covering Aspendell and is unenhanced except for the avalanche path outlines. A full and detailed analysis typically uses historical aerial photos to examine changes over time. These often come from a variety of agencies. AlpenPro has copies of all known photos for this area going back to the 1950's. Historical photos are not online and must be tracked down and special-ordered as prints. |
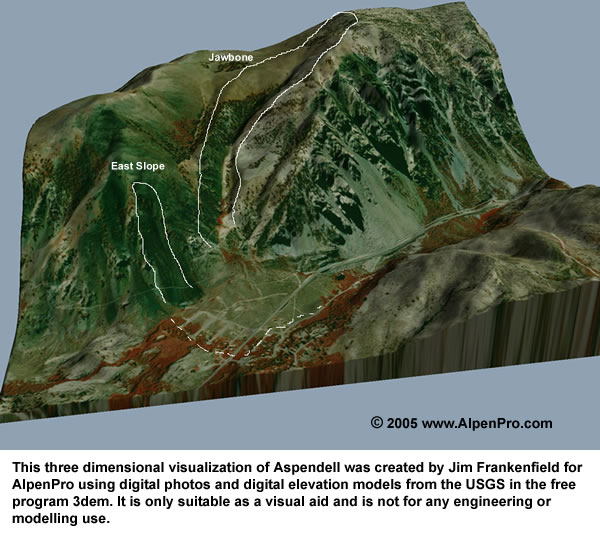 |
Aerial photography can be combined with digital elevations to create three dimensional models, and even fly-by movies. This one was created using the same .doq and .dem files as above and a free program called 3dem. Click on the model for a larger version. |
Jawbone Canyon Photographs |
|
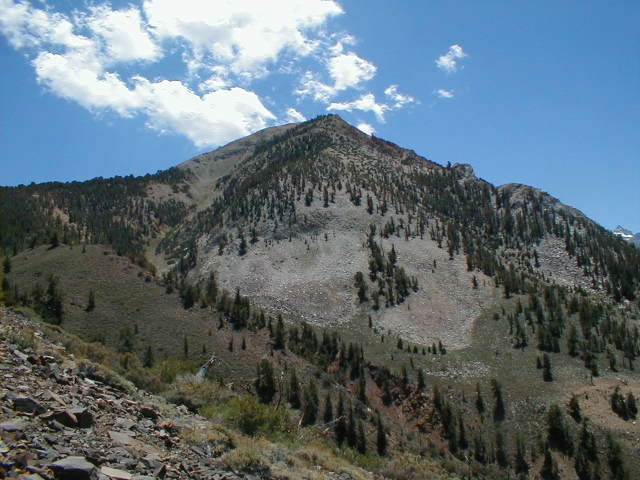 |
This shows the starting zone and upper avalanche path in Jawbone Canyon, on Table Mountain. This was taken from near the top of the East Slope during a field survey to obtain the slope profile directly. |
 |
This is the view looking out the bottom of Jawbone Canyon. While there is a ridge on the right side which offers some protection to that end of Tract 2 it does not prevent all damage. Dry snow avalanches can jump such barriers, and did so in 1986 and 1969. |
East Slope Photos |
|
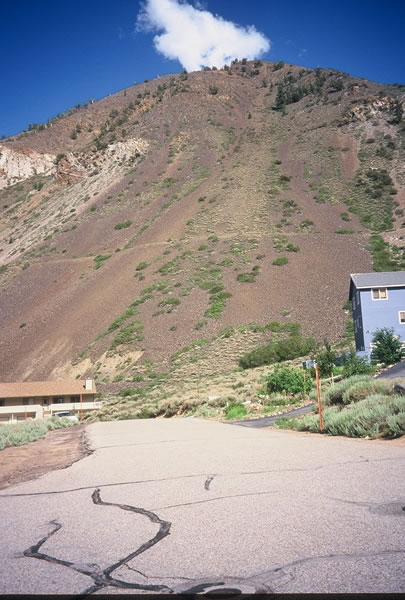 |
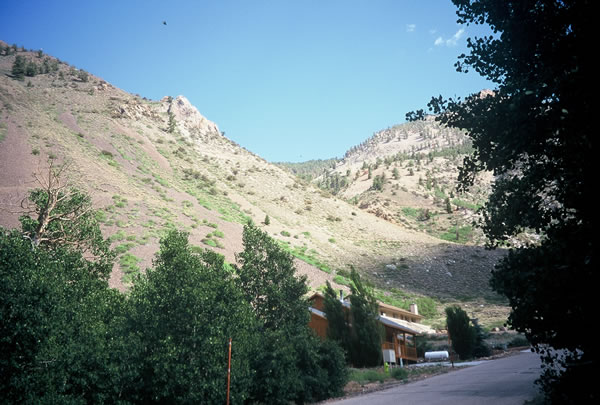
These two photos show the East Slope avalanche path, the top one is a head-on view looking East along Alpine and the lower one is a view south showing somewhat of a profile of the slope. Prevailing winds come from right and a bit out of the background in the top photo, which preferentially loads the central depression with packed snow. This path often looks dry and windblown and does not have the recent history that Jawbone has, so people seem to write it off as unimportant. A detailed analysis shows that a 100-year avalanche would run into the development to some extent. And with a profile that changes fairly abruptly from a good track angle of sliding to a lower run-out angle there is a potential for an air blast to form which would run further than the debris. Some aspects of such an analysis are shown below. |
 |
|
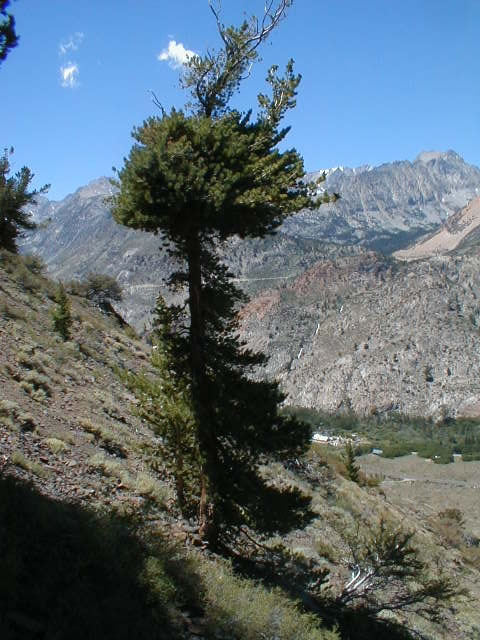 |
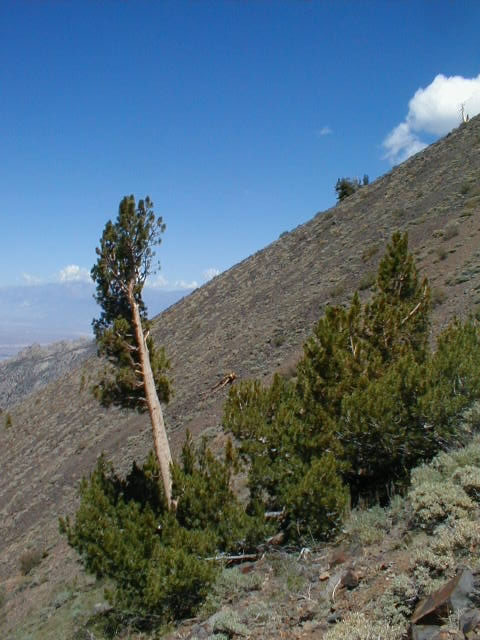
These two photos show some of the vegetation in the East Slope starting zone. While it has not run large enough to extend out into any development in recent times it's obvious that it has avalanched, probably on a regular basis. People who tend to write off this path have probably never hiked up to the starting zone and had a look around. Trees like these are called "flag trees" and are one of the most common indicators of avalanche activity. In this case they offer an indication of the height of snow released in the starting zone as well as showing that some level of activity is relatively common. |
 |
|
East Slope Velocity Profiles from Computer Models |
|
 |
This graph results from physically modeling the flow of snow down the fall line. For this graph one particular model was used, along with two variations of the basic version. The variations are related to the way in which the estimated friction parameters are handled. |
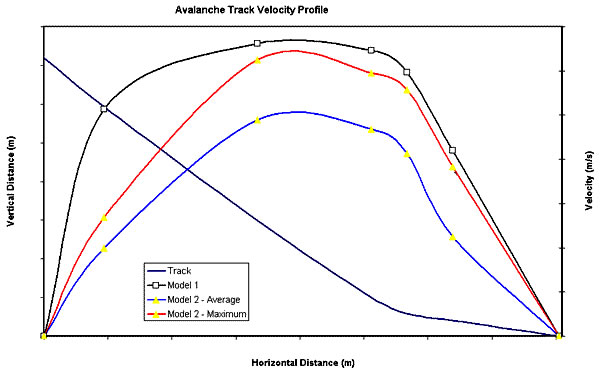 |
For this graph two different models were used. The highest line (Model 1) came from the same one used above. The other two lines are from a second model which is different and which calculates both an estimated average snow velocity and an estimated maximum velocity within the moving snow. |
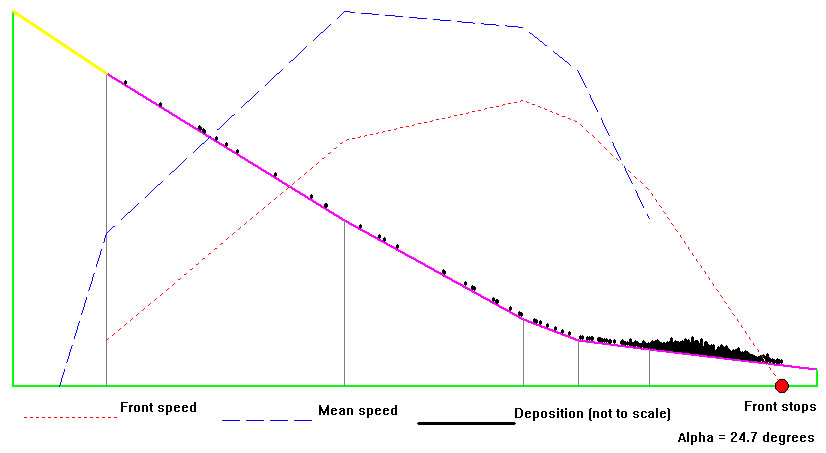 |
This is a model output which shows the estimated mean speed of the snow and the estimated speed of the front (for the initial impact). It also gives an idea of the final deposition. (The weight of this on any structure can be a significant design parameter.) You can also see the segments which the path was broken down into, with the starting zone shown in yellow. |
Excerpt from an Engineering Site-Specific Report |
|
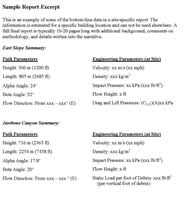 |
Based on some combination of field surveying, map and aerial photography interpretation, statistical modeling, and physical modeling a final report can be prepared. Ideally all of the above methods can be reconciled into some sense of reasonable agreement, although for complicated paths this is sometimes not possible. The East Slope is a "clean" path (an unconfined flow with a simple slope profile) and these methods can be brought into agreement by choosing the physics parameters for the models appropriately. Jawbone Canyon is much more complex since it is a confined flow which descends a curving channel and spills out onto an alluvial fan where it can spread. This excerpt shows tables with basic numerical parameters and estimates. Note that for the East Slope there is a potential for an airblast (or "powder avalanche") and therefore anticipated aerodynamic drag and lift pressures have been included in the engineering report. A full report is typically 10-20 pages long with additional information. Click on the image for a 1 page pdf. |
[ AlpenPro Home ] [ Portfolio Index ]